While the Trump administration works to restrict immigration to the United States, local elected leaders have stepped up in support of immigrant residents and their families. From setting up legal defense funds that provide representation to immigrants in deportation proceedings to creating immigrant affairs offices that serve as resources to foreign-born residents, they are addressing the on-the-ground reality of governing for all their constituents. Recognizing immigrants’ importance to their communities, more than 175 local elected officials, representing cities and counties of all sizes, have joined the Cities for Action coalition. In its work, the coalition advocates for the federal government to adopt policies supporting immigrants and their families at the national level.
H.R. 6, the American Dream and Promise Act, is an example of such a policy. The bill would put certain immigrants—Dreamers, including Deferred Action for Childhood Arrivals (DACA) recipients, as well as those eligible for Temporary Protected Status (TPS) and Deferred Enforced Departure (DED)—on a pathway to citizenship. Many of these immigrants have lived a large proportion of their lives in the United States under some sort of protected status before the Trump administration took office. Dreamers, for example, about one-third of whom remain protected under the DACA program, came to the United States when they were 8 years old, on average, while those eligible for TPS and DED have, on average, lived in the United States since 1997. This column highlights data from the 25 cities and counties with the largest numbers of immigrants eligible for protection under H.R. 6.
Immigrant communities and their families nationwide would benefit from H.R. 6
Not surprisingly, the two cities with the greatest number of individuals eligible for relief under the Dream and Promise Act are Los Angeles and New York. More than 100,000 Angelenos and more than 100,000 New Yorkers would be eligible for relief under the proposed legislation. (see Table 1)
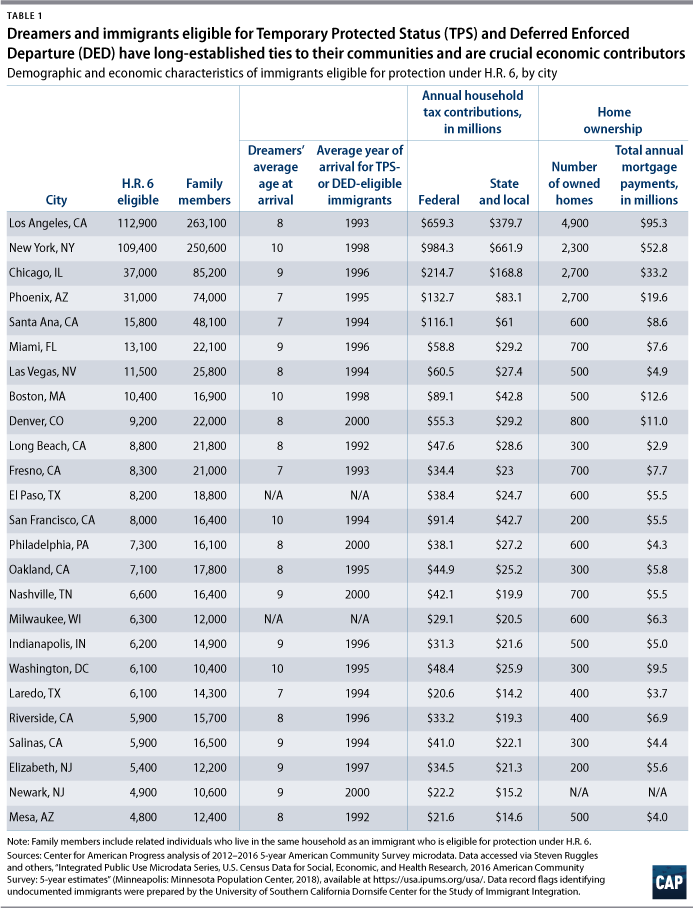
H.R. 6 would bring stability not just to the eligible immigrants but to their families as well. In many cities listed in Table 1, the number of individuals living in mixed-status families, meaning those who live with an H.R. 6-eligible family member but are not eligible themselves, is more than double the number of H.R. 6-eligible immigrants, emphasizing the ties this group has to the United States. Should these immigrants and their families be forced to leave the cities they call home, the disappearance of their tax contributions, spending power, and mortgage payments could have long-lasting repercussions.
Beyond cities, this column looks at county data, highlighting suburban areas with large H.R. 6-eligible communities.
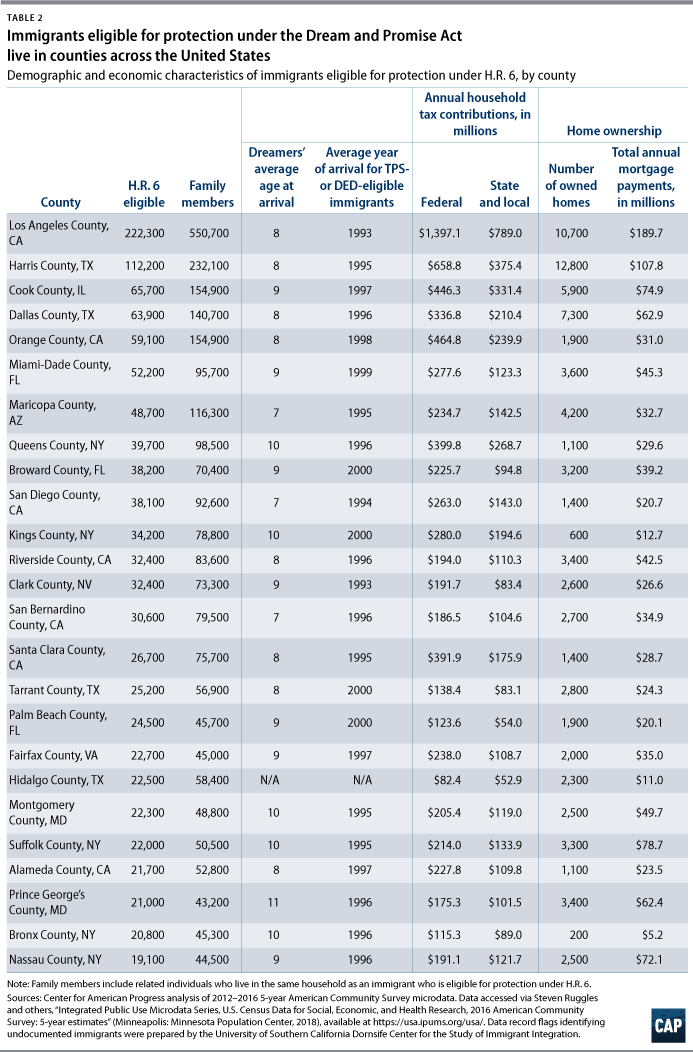
For example, Fairfax County in Virginia, as well as Montgomery County and Prince George’s County in Maryland, all of which are located in the Washington, D.C., metropolitan area, rank among the 25 most populous counties when it comes to immigrants eligible to apply for protection under the Dream and Promise Act.
Resources for city-level, county-level, state-level, and congressional district-level data
For detailed demographic estimates and economic contributions for 110 cities and 317 counties across the United States, please see this downloadable data spreadsheet. Each of these areas is home to more than 500 Dreamers and TPS- or DED-eligible immigrants who could be protected under the Dream and Promise Act.
For state-by-state demographic and economic data regarding Dreamers, please see the Center for American Progress’ recent column “The Dream and Promise Act County Put 2.1 Million Dreamers on Pathway to Citizenship.” For congressional district data, please see this interactive map produced in collaboration with the University of Southern California Dornsife Center for the Study of Immigration Integration, “American Dream and Promise Act of 2019 Populations and their Economic Contributions by U.S. Congressional District.”
Conclusion
Gridlock in Washington has stalled meaningful immigration reform for decades, giving mayors and county officials no choice other than to lead on the issue. But they know their actions can only go so far. Thus, they continue to make their demands for Congress clear: pass permanent protections for immigrants at the national level and give these individuals the security to live and work in their communities.
Nicole Prchal Svajlenka is a senior policy analyst of Immigration Policy at the Center for American Progress.
The author thanks the University of Southern California Dornsife Center for the Study of Immigration Integration for providing access to its data.
Methodology
The findings presented in this column are based on CAP analysis of 2012–2016 5-year American Community Survey microdata, with tags developed by the University of Southern California Dornsife Center for the Study of Immigrant Integration in order to identify eligibility for the Dream and Promise Act of 2019. Corresponding detailed congressional district-level data, as well as a methodological discussion, can be found here.
Places and counties are built by aggregating Public Use Microdata Areas (PUMAs). PUMAs are built from census tracts and counties and have at least 100,000 residents. Because of this, certain places and counties cannot be constructed without some error, either excluding certain residents or including individuals who are not residents of the jurisdiction. Data are presented for places and counties with a bounding error rate of less than 15 percent. Major cities that were excluded include Houston, San Antonio, Dallas, Fort Worth, and Austin in Texas; San Diego and San Jose in California; Charlotte, North Carolina; Columbus, Ohio; Louisville, Kentucky; and Albuquerque, New Mexico. However, for each of these cities, data can be presented for the county in which they are primarily located.
Household tax contributions and spending power estimates are based on methodology developed by New American Economy and include all households that contain a member who would be eligible for protection under the Dream and Promise Act of 2019, including immigrant youth who will be eligible to apply for Conditional Permanent Resident status once they enroll in secondary school. Federal tax rates come from the Congressional Budget Office, and state and local tax rates come from the Institute on Taxation and Economic Policy. Spending power is measured as household income after federal, state, and local tax contributions.