Introduction and summary
Across the United States, it is not unusual for child care tuition to be the first- or second-largest household expense for families, costing more than mortgage or rent.1 Many parents feel justifiably overwhelmed as they begin their child care search.2 Not only are parents faced with limited options, long waitlists, and a lack of information about programs, but they also are hit with a steep price tag, which in many cases is more than the cost of in-state tuition at a public college.3
Meanwhile, early childhood teachers are some of the lowest-paid professionals; nearly 40 percent of child care teachers rely on public assistance at some point in their careers.4 Early childhood programs themselves also operate on tight budgets. Most are small, independent businesses that are left to rely on in-kind support or philanthropic contributions to stay afloat.5
If child care teachers are paid so little and early childhood programs are struggling to make ends meet, many parents are justifiably left asking the question: Why does child care cost so much?
Where does your child care dollar go?
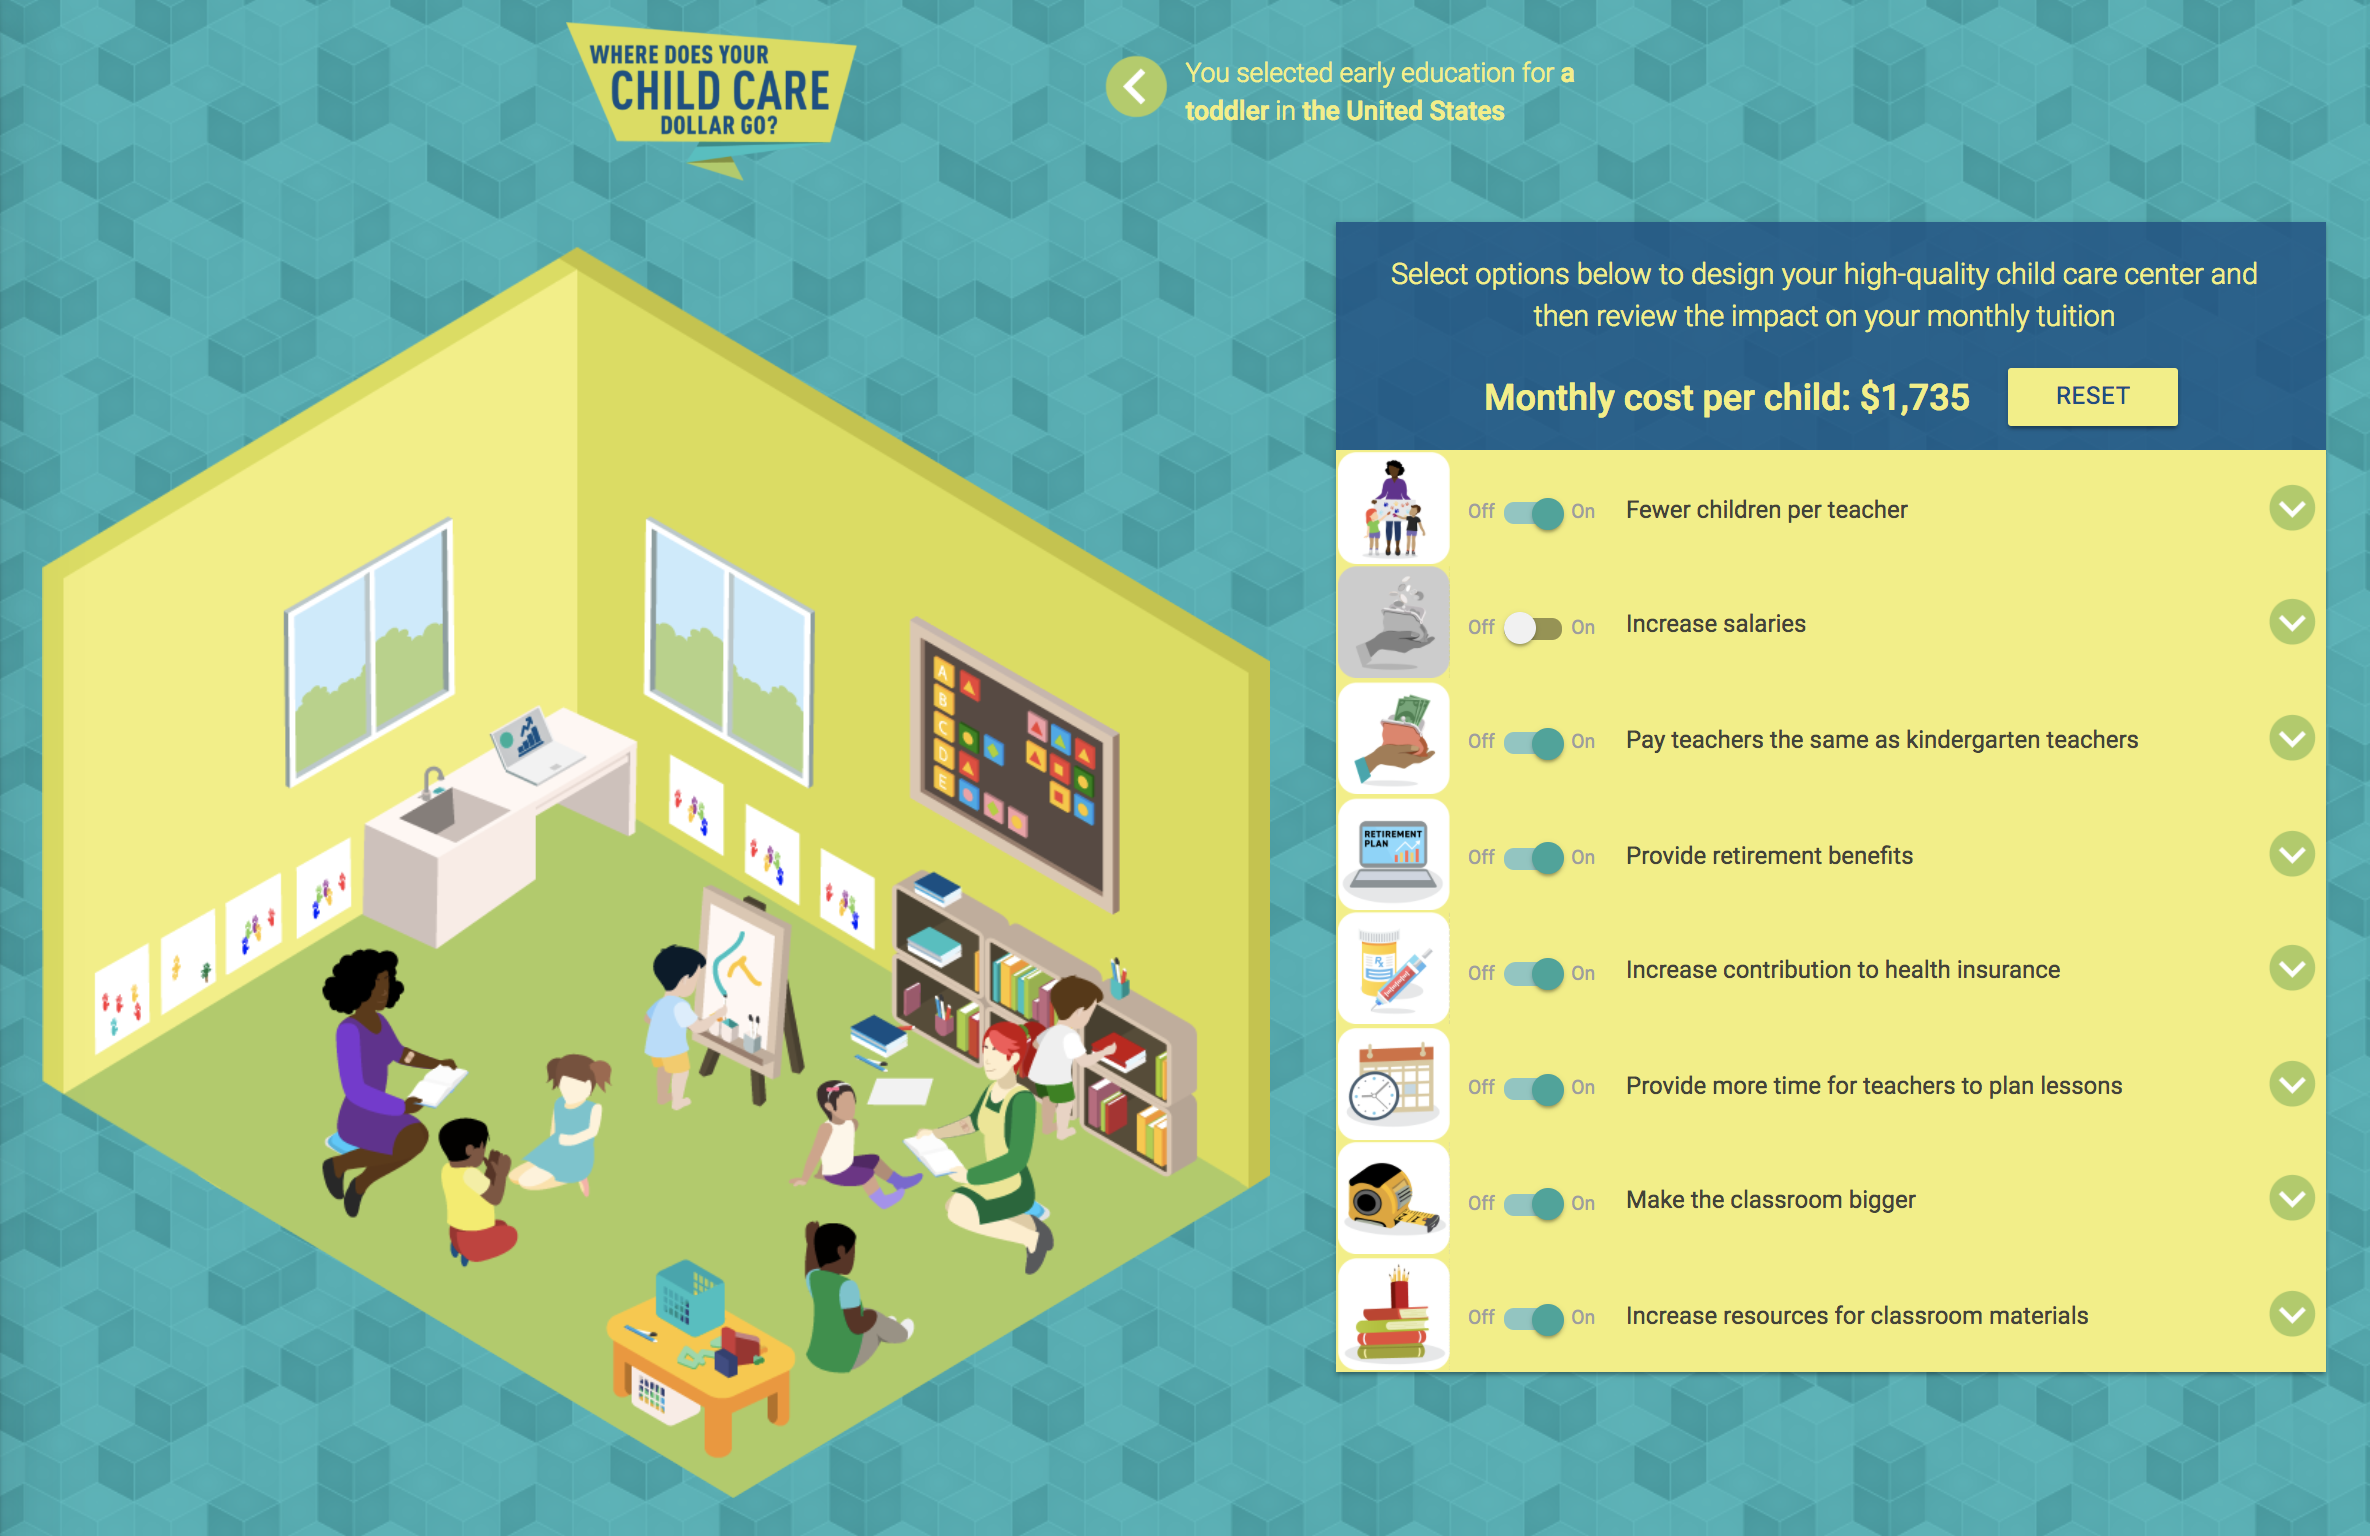
To answer this question, the Center for American Progress has developed an interactive tool that estimates the cost of high-quality child care in each state.6 In addition to calculating the monthly cost per child in a center-based program, the tool includes a breakdown of the main expenses that contribute to that cost.
While several states have done studies to estimate the cost of providing child care that meets state quality standards, these studies are time- and resource-intensive, and the results are often not widely accessible beyond a core policy audience.7 For the first time, this interactive offers a simplified way for parents and policymakers to estimate the true cost of providing high-quality child care in every state.8 The results can help users understand where their monthly tuition goes, how expenses change as quality increases, and why there is such a critical need for a new public investment in early childhood education.
The interactive is informed by national averages and integrates local data to provide state-specific estimates for the cost of care.9 Within the tool, users can modify seven elements of the child care program, including salaries, benefits, teacher-child ratios, and classroom materials. Each of these elements is tied to the quality of the program and has an associated cost. As users design their classroom, the tool calculates the monthly cost per child of providing care at the chosen level of quality. Full details of the assumptions and data sources used in the interactive are available in the accompanying methodology.10
Click the image below to view the interactive:
The interactive provides important information about the current state of the child care market. The tool can help answer the question of why child care costs so much, and it can be used to advocate for a public investment in child care that fully supports our nation’s youngest learners and their families.
The cost of child care is driven primarily by salary and benefits
Child care is a labor-intensive business. Children need well-trained teachers to care for them and engage them in age-appropriate play and activities. Unlike so many industries, child care cannot be automated, and while there may be room for efficiencies at the administrative level, an early childhood classroom will always need teachers.11 Analyses of early childhood program budgets find that the workforce is the largest expense, accounting for 60 percent to 80 percent of total program expenses.12 Teacher pay and benefits are therefore a significant driver of the cost of child care, in addition to policies related to teacher-child ratios and class sizes, which vary by the age of child served.
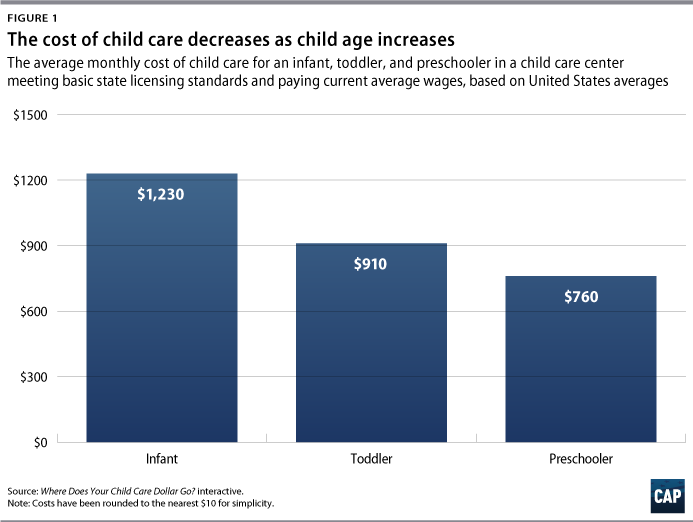
Data from the interactive illustrate the impact of child age on the cost of care. As shown in Figure 1, the per-child cost of care decreases as child age increases, due largely to lower ratios and group sizes for older children. For teachers to care for young children safely, ratios need to be low, with each teacher caring only for a limited number of children.13 From a practical point of view, infants and toddlers require more direct support than older children to engage with toys and materials and need adult assistance for feeding and diapering. The rapid development of young children’s brains in the first three years of life also means that low ratios are critical to ensure that teachers can focus on positive and responsive interactions, emerging language skills, and promoting socio-emotional development.14 As children get older and can perform more tasks independently and interact with each other, the number of children for which each teacher can adequately care increases, resulting in a decreased cost per child.
Typical distribution of child care expenses
The remaining 20 percent to 40 percent of expenses for a child care program fall broadly into three categories:
- Occupancy: including rent, utilities, and maintenance
- Office and administrative: including things such as supplies and equipment, internet and phone service, and fees and permits
- Classroom expenses: including educational supplies, observation tools and food
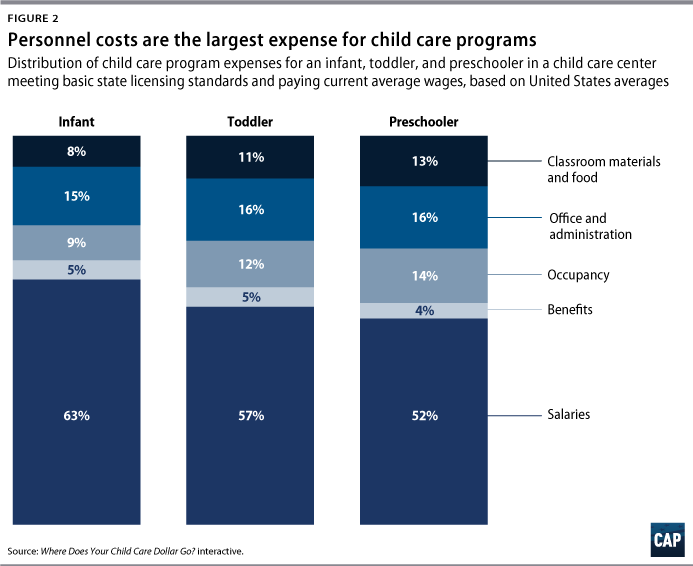
Figure 2 uses data from the interactive to illustrate the distribution of expenses in a typical child care program that meets minimum state licensing requirements and pays current average salaries and benefits.
While costs vary across states and between different programs, the distributions shown in Figure 2 are typical. Occupancy costs can vary significantly, based on geography and the program setting. For example, many center-based child care programs are co-located in community centers, churches, or other public spaces that provide reduced rents or utilities or provide in-kind support that helps subsidize the cost of operating the program.15 This allows programs to keep tuition low or to offer additional services without increasing tuition fees.
High-quality programs provide higher teacher compensation
The greatest determinant of program quality is the teacher—specifically, the quality of their interactions with children.16 Children begin learning from birth, but this learning comes primarily through everyday interactions rather than the formal educational setting of the K-12 years. A highly skilled teacher will structure a learning environment based on young children’s development and interests and use verbal and nonverbal responses to engage children as they explore their environment. As young children’s brains are rapidly developing, a highly skilled teacher will build a “unique relationship with each child in her care,” using her training, experience, and observation of each child “to take advantage of learning opportunities that emerge through daily routines.”17
Current compensation levels leave many early childhood teachers living in poverty, often relying on public assistance programs.
To recruit and retain teachers with appropriate qualifications and experience to support young children’s development, programs need to offer adequate compensation. Current compensation levels leave many early childhood teachers living in poverty, often relying on public assistance programs. As a result, many teachers suffer from economic anxiety and report “worrying about having enough food for their family … covering routine health expenses, and … paying their monthly bills.”18 The stress of living in poverty not only affects teachers and their families but can also have negative consequences for the children in their care.19 When teachers are stressed about their ability to provide for their own family, they are less likely to engage in positive interactions with children, making it challenging to build a supportive learning environment.20 As a result, compensation needs to be sufficient to recruit and retain highly skilled teachers and ensure that teaching in an early childhood program can be a sustainable long-term career choice that allows teachers to provide for their own families.
The interactive allows users to modify several options related to personnel and see the impact on the cost of child care. Users can build a scenario where teachers are compensated at a level comparable to that of public kindergarten teachers—including parity for both salary and benefits—or where compensation is increased to a midway point between current compensation and kindergarten parity. Salaries vary considerably by state, but the average kindergarten teacher salary in the United States is just more than $55,000, while the average child care teacher salary is $33,000.21 Providing parity with kindergarten teachers would provide early childhood teachers in most communities with a relatively sustainable family income.22 However, by no means does this represent a high salary. Many teachers could earn substantially more in other fields, with K-12 teachers in the United States paid, on average, 60 percent less than “other professionals with similar education levels.”23 Full details of salary data used in the interactive are available in the accompanying methodology.24
In addition to increasing salary and benefit levels, users can build a scenario with improved teacher-child ratios and group sizes. The improved ratios and group sizes are aligned with the National Association for the Education of Young Children (NAEYC) accreditation standards.25 NAEYC is one of only a few nationwide accreditation bodies and is widely recognized as an indicator of high quality. Lower ratios and group sizes provide teachers with an increased ability to focus on the needs of individual children and tailor their interactions appropriately. The interactive allows users to see the direct impact of changes to these policies on the monthly cost of child care and can explore the trade-offs between cost and quality.
What is high-quality child care?
With mounting evidence that the first five years of a child’s life are critical to their developmental trajectory, there is a growing consensus to define and implement high-quality child care programs.26 Almost all states have a quality rating and improvement system (QRIS), which defines, measures, and supports quality.27 While these QRIS share many traits, each one is unique and reflects a different vision of what it means to be high quality. Similarly, there are several state and national accreditation bodies, such as NAEYC and the National Association for Family Child Care (NAFCC), that evaluate programs and provide an accreditation based on their own definition of quality.28 Recognizing the importance of teachers to program quality, many of these rating bodies or accreditation systems integrate some form of classroom observation or teacher interaction assessment. The Classroom Assessment Scoring System (CLASS) is one of the most widely used instruments to assess teacher-child interactions and since 2011 has been utilized during monitoring reviews of center-based Head Start programs.29
Given the importance of teachers to program quality, and the link between compensation and teacher qualifications, references to high quality in this report and the interactive tool denote a program that provides robust compensation and benefits. This is defined as providing teacher pay at parity with public school kindergarten teachers, including health insurance and retirement benefits. This allows programs to recruit and retain experienced and highly skilled teachers. In addition, high-quality programs have low teacher-child ratios, additional resources for materials, and a larger learning environment that provides more space to explore and learn.
A tale of two child care programs
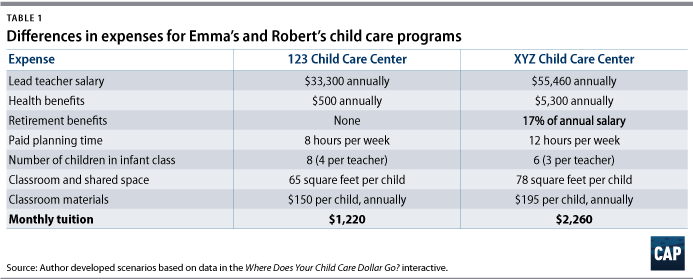
Imagine two child care programs operating within a couple of blocks of each other downtown in a midsize American city. In a nearby office building, two workers who recently returned from family leave discuss their child care situation. Emma enrolled her son in the 123 Child Care Center, while Robert enrolled his daughter in the XYZ Child Care Center. Robert is shocked to learn that Emma pays $1,200 per month for full-time care, while he is paying more than $2,200 for his daughter’s program. As they discuss their respective programs, Emma and Robert realize that there are some significant differences between the two programs.
Some of these differences are clear to Robert and Emma. During his tour of the program, Robert learned that on average, teachers have been at his daughter’s center for about 15 years, and that the center director has been there since it opened. There are only six children in his daughter’s class, and at drop-off and pick-up time, he has often seen teachers down on the floor reading, interacting, and playing with the children. There are three parent-teacher conferences scheduled throughout the year, and parents are encouraged to volunteer in the classroom. Meanwhile, Emma has already experienced a change in director since registering for the program, and a teacher she met on her program tour was no longer working at the center by the time of her son’s first day. With eight children in the class, pick-up and drop-off times are chaotic, and while the teachers seem nice, they are often too busy changing diapers or calming a fussy child to give Emma feedback or details about her son’s day.
There are also differences that Robert and Emma cannot see. In Robert’s program, teachers are paid salaries similar to those of local kindergarten teachers and receive full health benefits, and the program contributes to a retirement plan. This allows teachers to make a career out of being an early childhood educator and reduces turnover in the program. The program also provides ample time for teachers away from the classroom to develop lesson plans and meet with the curriculum director. In Emma’s program, teachers are paid only slightly more than minimum wage and receive only limited health insurance benefits. This leaves most of the teachers living in poverty, relying on public assistance programs, and facing daily stress about caring and providing for their own families. Teachers often leave for other fields with higher pay and benefits or, after gaining more experience, move to a different early childhood program where they can be better compensated.
Using the interactive, it is possible to model these two hypothetical programs and illustrate the key differences in their expenses. Table 1 summarizes these differences.
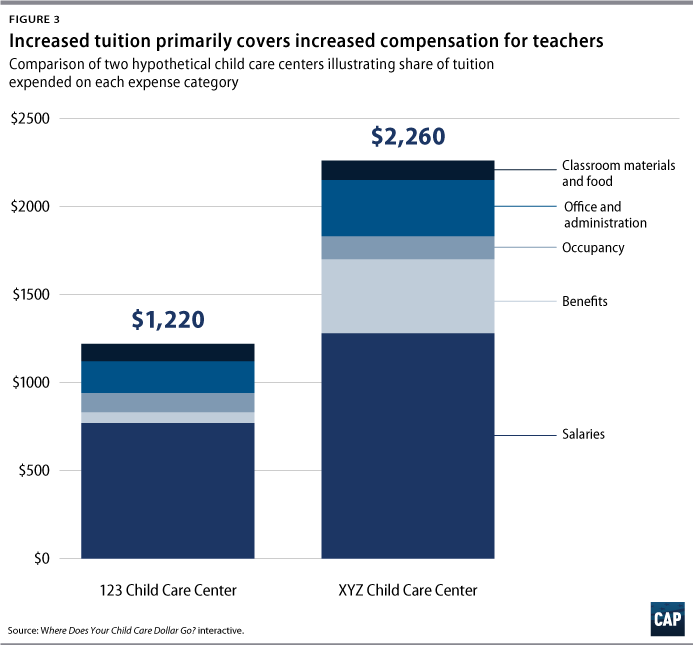
Figure 3 illustrates where the monthly child care tuition for these two programs is spent. The increased salaries and benefits offered by XYZ Child Care Center results in nearly $900 of the $1,000 difference between Robert’s and Emma’s monthly tuition going directly to teacher compensation. Conversely, while parents with children in 123 Child Care Center likely feel grateful to have found a program that they can afford, the tool shows that this comes at the expense of provider wages and benefits.
While Robert and Emma’s experience is a hypothetical scenario, it illustrates the significant differences that exist between programs in the child care market today and just how out of reach child care is for many families. At more than $27,000 per year for an infant, the high-quality scenario represented by XYZ Child Care costs more than the annual earnings for a minimum wage worker in every state.30 Even the $15,000 annual tuition at 123 Child Care Center is about equal to the total average annual earnings of someone making the federal minimum wage of $7.25 per hour. Even if Emma and Robert had family incomes in line with the U.S. median of nearly $58,000 per year,31 they would still find themselves paying 25 percent and 47 percent of their family incomes, respectively, just for child care.
What is the cost of high-quality child care in each state?
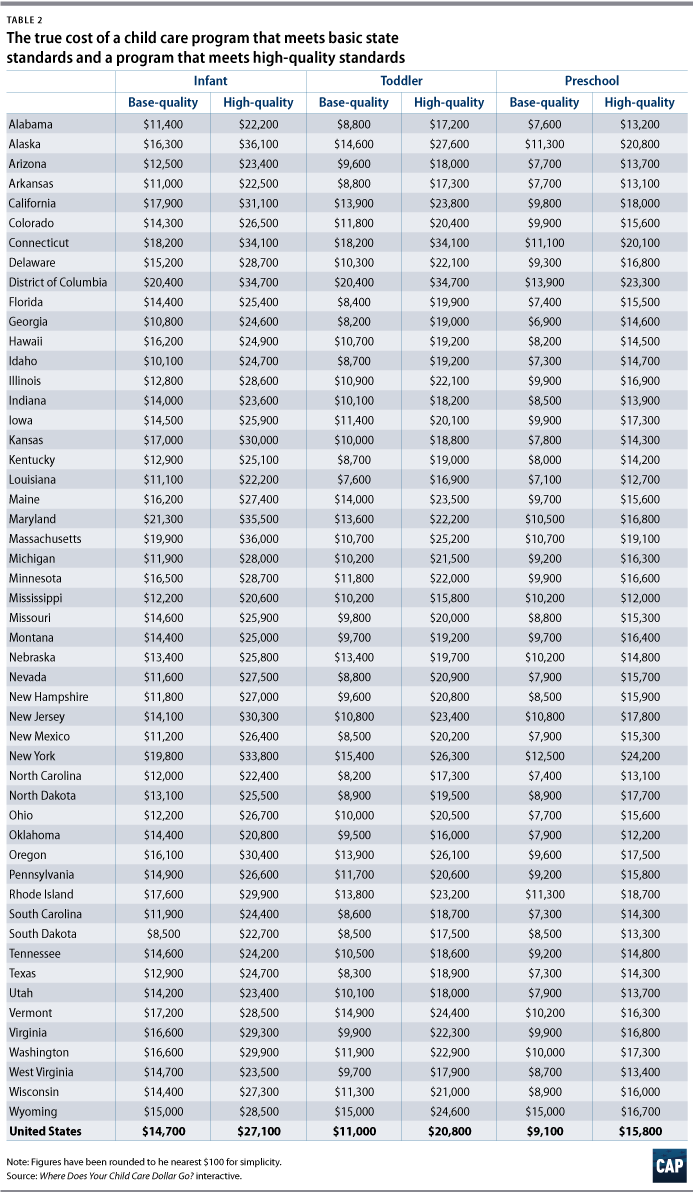
Using data from the interactive tool, Table 2 presents a summary of the cost of a high-quality program in each state, paying higher salaries and benefits and going above and beyond licensing standards. As a comparison, the table also includes details of the cost in a program paying current average salaries and meeting basic licensing state standards.
Is quality worth the cost?
The data in the interactive make it clear that quality comes with a significant cost. The current child care industry is built on the backs of child care teachers, and tuition prices are kept artificially low at the expense of teacher compensation. However, for many families struggling to afford the current price of child care, or policymakers struggling with budget shortfalls, it is nonetheless reasonable to ask whether high quality is worth the high cost.
Some elements of a quality program—such as teacher background checks and environmental standards—are clearly worth the cost from a health and safety perspective.32 Others, such as low ratios and small group sizes, allow for high-quality, developmentally appropriate interactions that have a direct impact on the socio-emotional, language, and brain development of young children. Other benefits of high-quality child care are less immediate and harder to quantify on a daily basis. For example, researchers have found that attendance in a high-quality early childhood program has short- and long-term benefits for children, their families, and the wider society.33 These benefits range from reduced need for special education services or remedial support during the K-12 years to reduced dependency on government assistance in adulthood and increased tax revenue.34 Attempts to quantify these benefits have found a return on investment of between $3 and $13 for every dollar invested in early childhood.35 Even at the low end of this estimate, this is a significant return.
To support the healthy development of children and ensure they are ready for kindergarten, it is critical to invest in early childhood teachers.
Research makes clear that the benefits of early childhood education come from programs where teachers have the time and resources to provide age-appropriate activities and engage children with positive interactions.36 This in turn requires small class sizes and adequate compensation to recruit and retain highly skilled teachers. Children are actively learning from the moment they are born, and every interaction offers a learning opportunity. From language development to social and emotional skills, early childhood teachers have a critical role to play in the development of young children.37
Offering competitive salaries and benefits can reduce turnover, keep experienced teachers in the field, and help ensure that teachers can focus on the immediate needs of the children in their care—rather than on coping with the economic anxiety that often comes with low-wage work.38 If early childhood programs are to support the healthy development of children and ensure they are ready for kindergarten, it is critical that we invest in teachers.
Current revenue streams are inadequate
In addition to answering the question of why high-quality child care costs so much, data from the interactive can be used to better understand the inadequacies of the current revenue streams available to early childhood education programs. Private tuition is the largest source of revenue for child care programs, comprising approximately 60 percent of total industry revenue. Federal, state, and local government funding covers 39 percent, and philanthropy covers the other 1 percent.39
The difference between ‘price’ and ‘cost’
Numerous articles and reports have highlighted the high cost of child care.40 These data are primarily based on reported tuition rates at child care programs, which reflect the price that families pay for child care, rather than the actual cost of operating the program. There are several factors that affect tuition rates, but primarily, programs set their tuition based on what parents can afford to pay. A program will ensure that its tuition is set relative to other programs in the community—adjusting for quality and other factors—but ultimately, there is a range that the market can support. In contrast, the cost of child care is the expenses that a program actually incurs in order to operate. All too often, there is a gap between the price the market can bear and the cost of operating a program, leaving programs struggling to stay afloat.41 This gap is even wider when considering the cost to operate a high-quality program with a well-compensated workforce.
Families cannot afford the true cost of quality
In almost every state, there is a gap between what parents are currently paying for child care and the cost to provide care that meets minimum standards. This gap is even larger when considering the difference between current tuition rates and the cost of high-quality care with adequate teacher compensation. In most cases, families are only able to afford child care because teacher pay is so low, meaning that the current child care industry relies on child care workers being poorly compensated.
However, the cost of child care is already a significant burden for most families.42 Data from the National Survey of Early Care and Education found that among households with child care expenses, those at or below 100 percent of the federal poverty level—with an annual income of about $20,000 for a family of three—spent an average of 33 percent of their income on early care and education programs. Even for families above 300 percent of the federal poverty level—with an annual income of about $61,000 for a family of three—the average share of income spent on child care was 11 percent.43 In contrast, the U.S. Department of Health and Human Services recommends that to be accessible, child care should cost families no more than 7 percent of their annual income.44
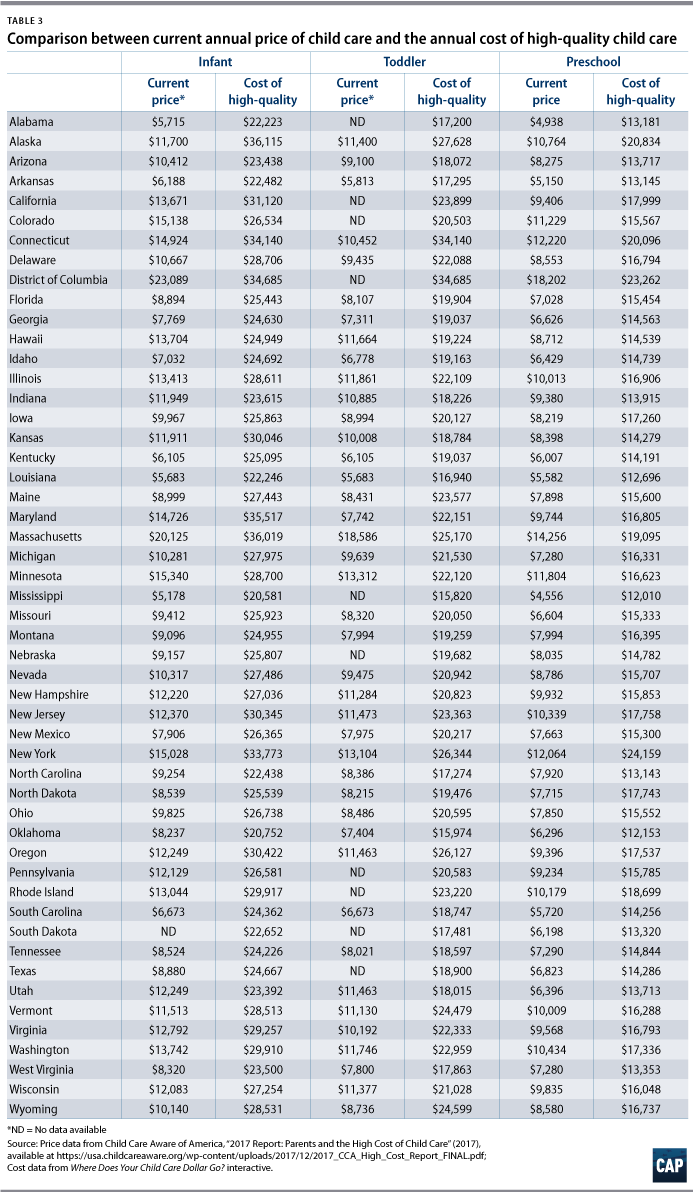
As a result, most families cannot afford to pay the increased tuition that is necessary to cover the true cost of a high-quality program. Table 3 highlights the significant gap between the price currently charged by programs and the estimated cost of a high-quality program. As shown, the cost of high-quality care for an infant is between 50 percent and 311 percent higher than the current market rate.
Public funding does not come close to covering the cost of high quality
The primary source of public funding for child care comes from the Child Care and Development Block Grant (CCDBG), which funds child care assistance for 1.4 million low-income children each month.45 States are supposed to set rates at the 75th percentile of current tuition rates. As of 2017, however, only two states had set their rates at this level.46 Furthermore, these rates are based on current tuition prices, rather than the actual cost of providing quality care. As a result, the current low wages and scarce resources are embedded into the subsidy system and restrict the ability of providers who serve child care assistance-eligible children from increasing pay and benefits.
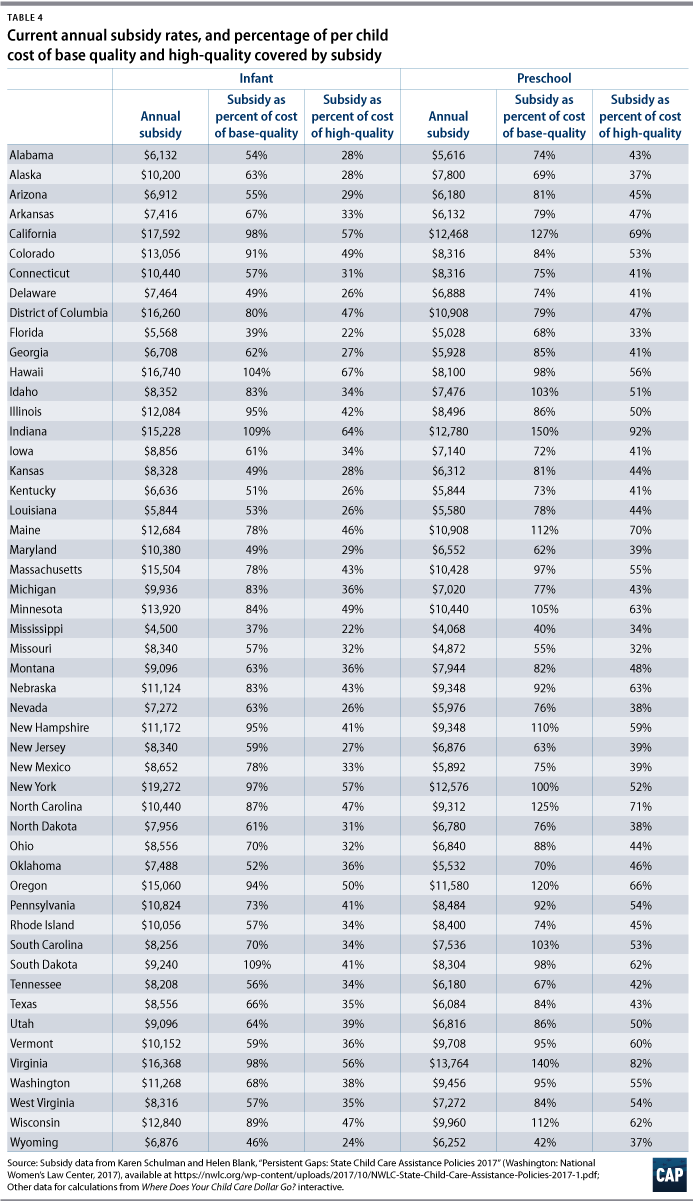
Table 4 highlights the impact this has on programs that rely on child care subsidy revenue. In only three states—Hawaii, Indiana, and South Dakota—does the infant subsidy cover the full cost of minimum quality, which is based on current wages and benefits. In no state does the subsidy cover the cost of high quality for infants or preschoolers.
The child care subsidy system is already stretched thin, with only 1 in 6 eligible children receiving the subsidy.47 In addition, eligibility levels are so low that a family of three with an annual income of just more than $30,000 fails to qualify for assistance in 15 states.48 With federal funding at a 12-year low,49 rates cannot increase to the level needed to cover the true costs of operating a high-quality program without drastically reducing the number of children served.
The case for increased public investment
The care of the United States’ youngest children is not purely a family matter. These young children are the future American workforce—they are the doctors that will care for us when we are sick, the teachers who will guide the next generation, and the engineers who will design still-unimaginable inventions. Society has a stake in the development of young children. Unfortunately, the current state of early learning in the nation puts the burden squarely on the shoulders of families, and that burden is often too heavy to bear.50 As a result, only upper-income families can afford high-quality early childhood programs. Children from lower-income households are left behind, furthering inequality and setting the stage for the achievement gap that persists through high school.
The revenue streams currently available to child care providers are insufficient to cover the costs of providing high-quality care.
The data presented in the “Where does your child care dollar go?” interactive and this report make it clear that the child care market is broken.51 The revenue streams currently available to child care providers are not sufficient to cover the costs of providing high-quality care. Meanwhile, decades of research have made the case for high-quality care and have illustrated the benefits it brings to children, families, and society.52 Yet high-quality early childhood programs remain out of reach for too many families.
To fully address the issues of affordability, accessibility, and quality, a significant new public investment in early childhood education is needed. This investment must go far beyond the current subsidy system, provide support to all low- and middle-income families, and ensure that early childhood teachers are compensated fairly.53 Helping parents and policymakers understand the true cost of high-quality child care is an important step in building support for this public investment.
About the author
Simon Workman is the associate director of Early Childhood Policy at the Center for American Progress. His work focuses on elevating the need for high-quality, affordable early childhood education programs and identifying policy solutions that improve program quality, increase access, and support additional public investment in young children. He also leads the team’s state child care policy work, providing state legislators, advocates, and administrators with technical assistance, research, and testimony on early childhood policy. Prior to joining the Center, Workman was a consultant in Denver, Colorado, where he conducted research, policy and data analysis, and evaluations on a variety of early childhood education issues at the federal, state, and local levels. Workman holds a bachelor’s degree from the University of Wales, Swansea, and a master’s degree in public policy and public administration from the University of York.
Acknowledgments
The author wishes to thank Anne Mitchell and Katie Hamm for their contributions to this report, interactive, and methodology. Special thanks also to Mat Brady for developing the interactive tool.